
Inside the Delta Lake Transaction Log: From Write to Time Travel
How 2KB JSON files control your 10TB table, and why OPTIMIZE temporarily doubles your storage before making queries faster

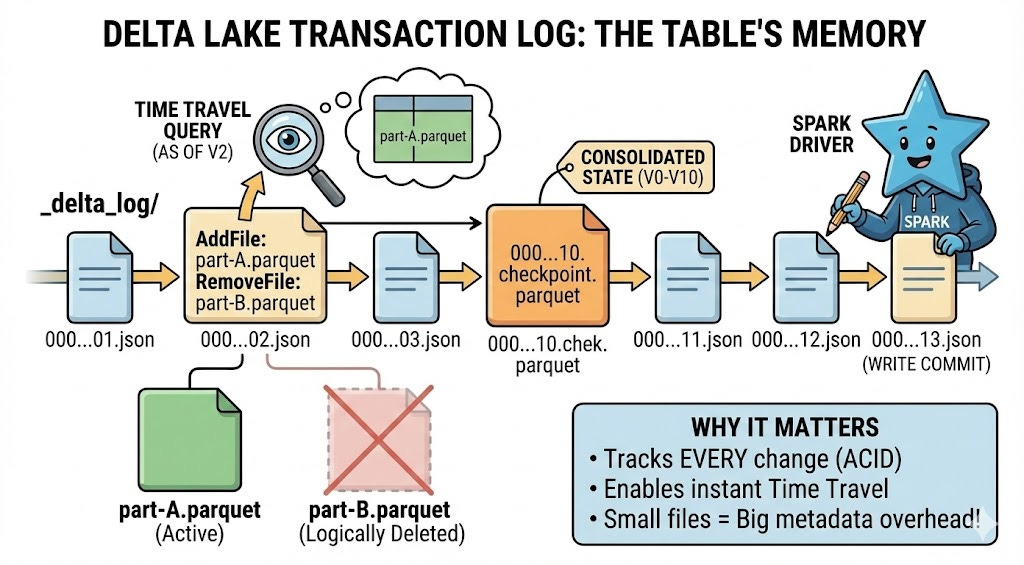
Every Delta Lake table write creates a tiny JSON file in _delta_log/. That 2KB file is why your 10TB table can time travel instantly - and why your table might be slow even with perfect data files.
This deep-dive traces the complete lifecycle of Delta Lake’s transaction log: from initial write through checkpointing, time travel queries, VACUUM operations, and OPTIMIZE commands. You’ll understand what’s really happening behind every Delta operation and why certain performance patterns emerge.
Why This Matters
Most Databricks engineers interact with Delta Lake daily but never look inside the transaction log. They run OPTIMIZE and assume small files are gone. They execute VACUUM and expect immediate cleanup. They query VERSION AS OF and think it’s instant magic.
Understanding the transaction log’s mechanics helps you:
Debug mysterious performance degradations - Why table scans suddenly slow down after months of smooth operation
Optimize checkpoint strategy - When to manually trigger checkpoints for high-frequency write workloads
Prevent VACUUM disasters - Why time travel queries fail even though DESCRIBE HISTORY shows the version exists
Design better table architectures - How write frequency affects metadata overhead regardless of data volume
Answer senior interview questions - “Explain how Delta Lake achieves ACID transactions” requires understanding the transaction log
Let’s trace the complete journey.
Part 1: The Write Operation - How Transaction Log Entries Are Created
Step 1: Write Operation Begins (Driver Node)
You execute a write operation - INSERT, UPDATE, DELETE, or MERGE. The Spark driver node receives your command and begins coordinating the distributed write.
Catalyst Optimizer generates a physical plan showing which executors will write which partitions. Each executor prepares to write new Parquet data files to your table location (S3, ADLS, or DBFS).
What you don’t see yet: No transaction log entry exists. Your write is not visible to any reader. Delta’s ACID guarantee means it’s all-or-nothing.
Step 2: Executors Write Data Files
Executors write new Parquet files to the table’s base path. Each file gets a UUID-based name like part-00000-8b7e3f2a-4c9d-4a5e-9b1f-5e8c7d6a9b2c-c000.snappy.parquet.
Critical detail: Files are written but not yet “committed”. Any reader scanning the directory right now won’t see these files. They’re orphaned until the transaction log commits.
Why immutable storage? Delta never modifies existing files. Updates and deletes don’t overwrite files - they write new files with updated records and mark old files as logically deleted. This enables time travel and crash recovery.
Step 3: Transaction Log Commit (Atomic Operation)
The driver node creates a new JSON file in _delta_log/ with format 00000000000000000042.json (version 42). This single file contains:
AddFile entries: Every new Parquet file written, with:
Full path and file size
Min/max statistics for each column (for data skipping)
Number of records
Partition values if table is partitioned
Modification timestamp
RemoveFile entries (for updates/deletes): Logical deletion pointers to old files that should no longer be read. The actual Parquet files remain on disk (for time travel) but Delta marks them as removed in this version.
OperationMetrics: Number of rows added/updated/deleted, execution time, files read/written, bytes scanned.
CommitInfo: Timestamp, user identity, operation type (WRITE, MERGE, DELETE, etc.), notebook/job ID, cluster ID.
This commit is atomic: Either the JSON file writes successfully and the transaction commits, or it fails and nothing changes. Readers either see the complete new state or the old state - never partial writes.
Step 4: Write Completes - Data Is Now Visible
Once the transaction log entry commits, your write is complete. Any subsequent reader will:
Scan
_delta_log/for the latest JSON file (highest number)Read all JSON files from 00000000000000000000.json to the latest
Build a picture of which files are currently valid (all AddFile entries minus RemoveFile entries)
Read only those valid Parquet files
The emerging problem: After 100 writes, readers scan 100 JSON files to determine which files exist. After 10,000 writes, they scan 10,000 JSON files. This metadata overhead grows linearly with transaction count, regardless of data size.
Part 2: The Checkpoint System - Solving the 10-Million-File Problem
Step 5: Checkpoint Trigger (Automatic at Regular Intervals)
Databricks monitors transaction log length and creates checkpoints automatically at regular intervals (configurable via delta.checkpointInterval property).
The default interval is 100 commits in recent Databricks Runtime versions. Tables created before DBR 11.1 may have a default of 10 commits. When the checkpoint version is reached, an automatic checkpoint process triggers in the background.
You don’t explicitly trigger this - it happens automatically. However, OPTIMIZE operations can trigger checkpoint creation as a side effect.
Why checkpoints exist: Without them, reading a table with 100,000 commits requires scanning 100,000 tiny JSON files just to figure out which data files exist. This metadata operation would take longer than reading the actual data.
