
Spark Performance Interview Questions: What Interviewers Actually Evaluate
An interviewer's insider view on the diagnostic framework that wins $200k+ Databricks Data Engineering offers.

In this post, we’ll cover:
The 3 signals interviewers actually track: Why asking questions before proposing solutions separates mid from senior
The complete diagnostic framework: The 4-step sequence that demonstrates production-grade thinking
5 bottleneck categories you must distinguish: Data skew vs disk spill vs shuffle overhead vs parallelism vs small files
Common follow-up questions decoded: What each follow-up actually evaluates and how to answer
Practice framework: 4 exercises to build diagnostic instinct before your interview
Here’s what candidates miss and how to fix it.
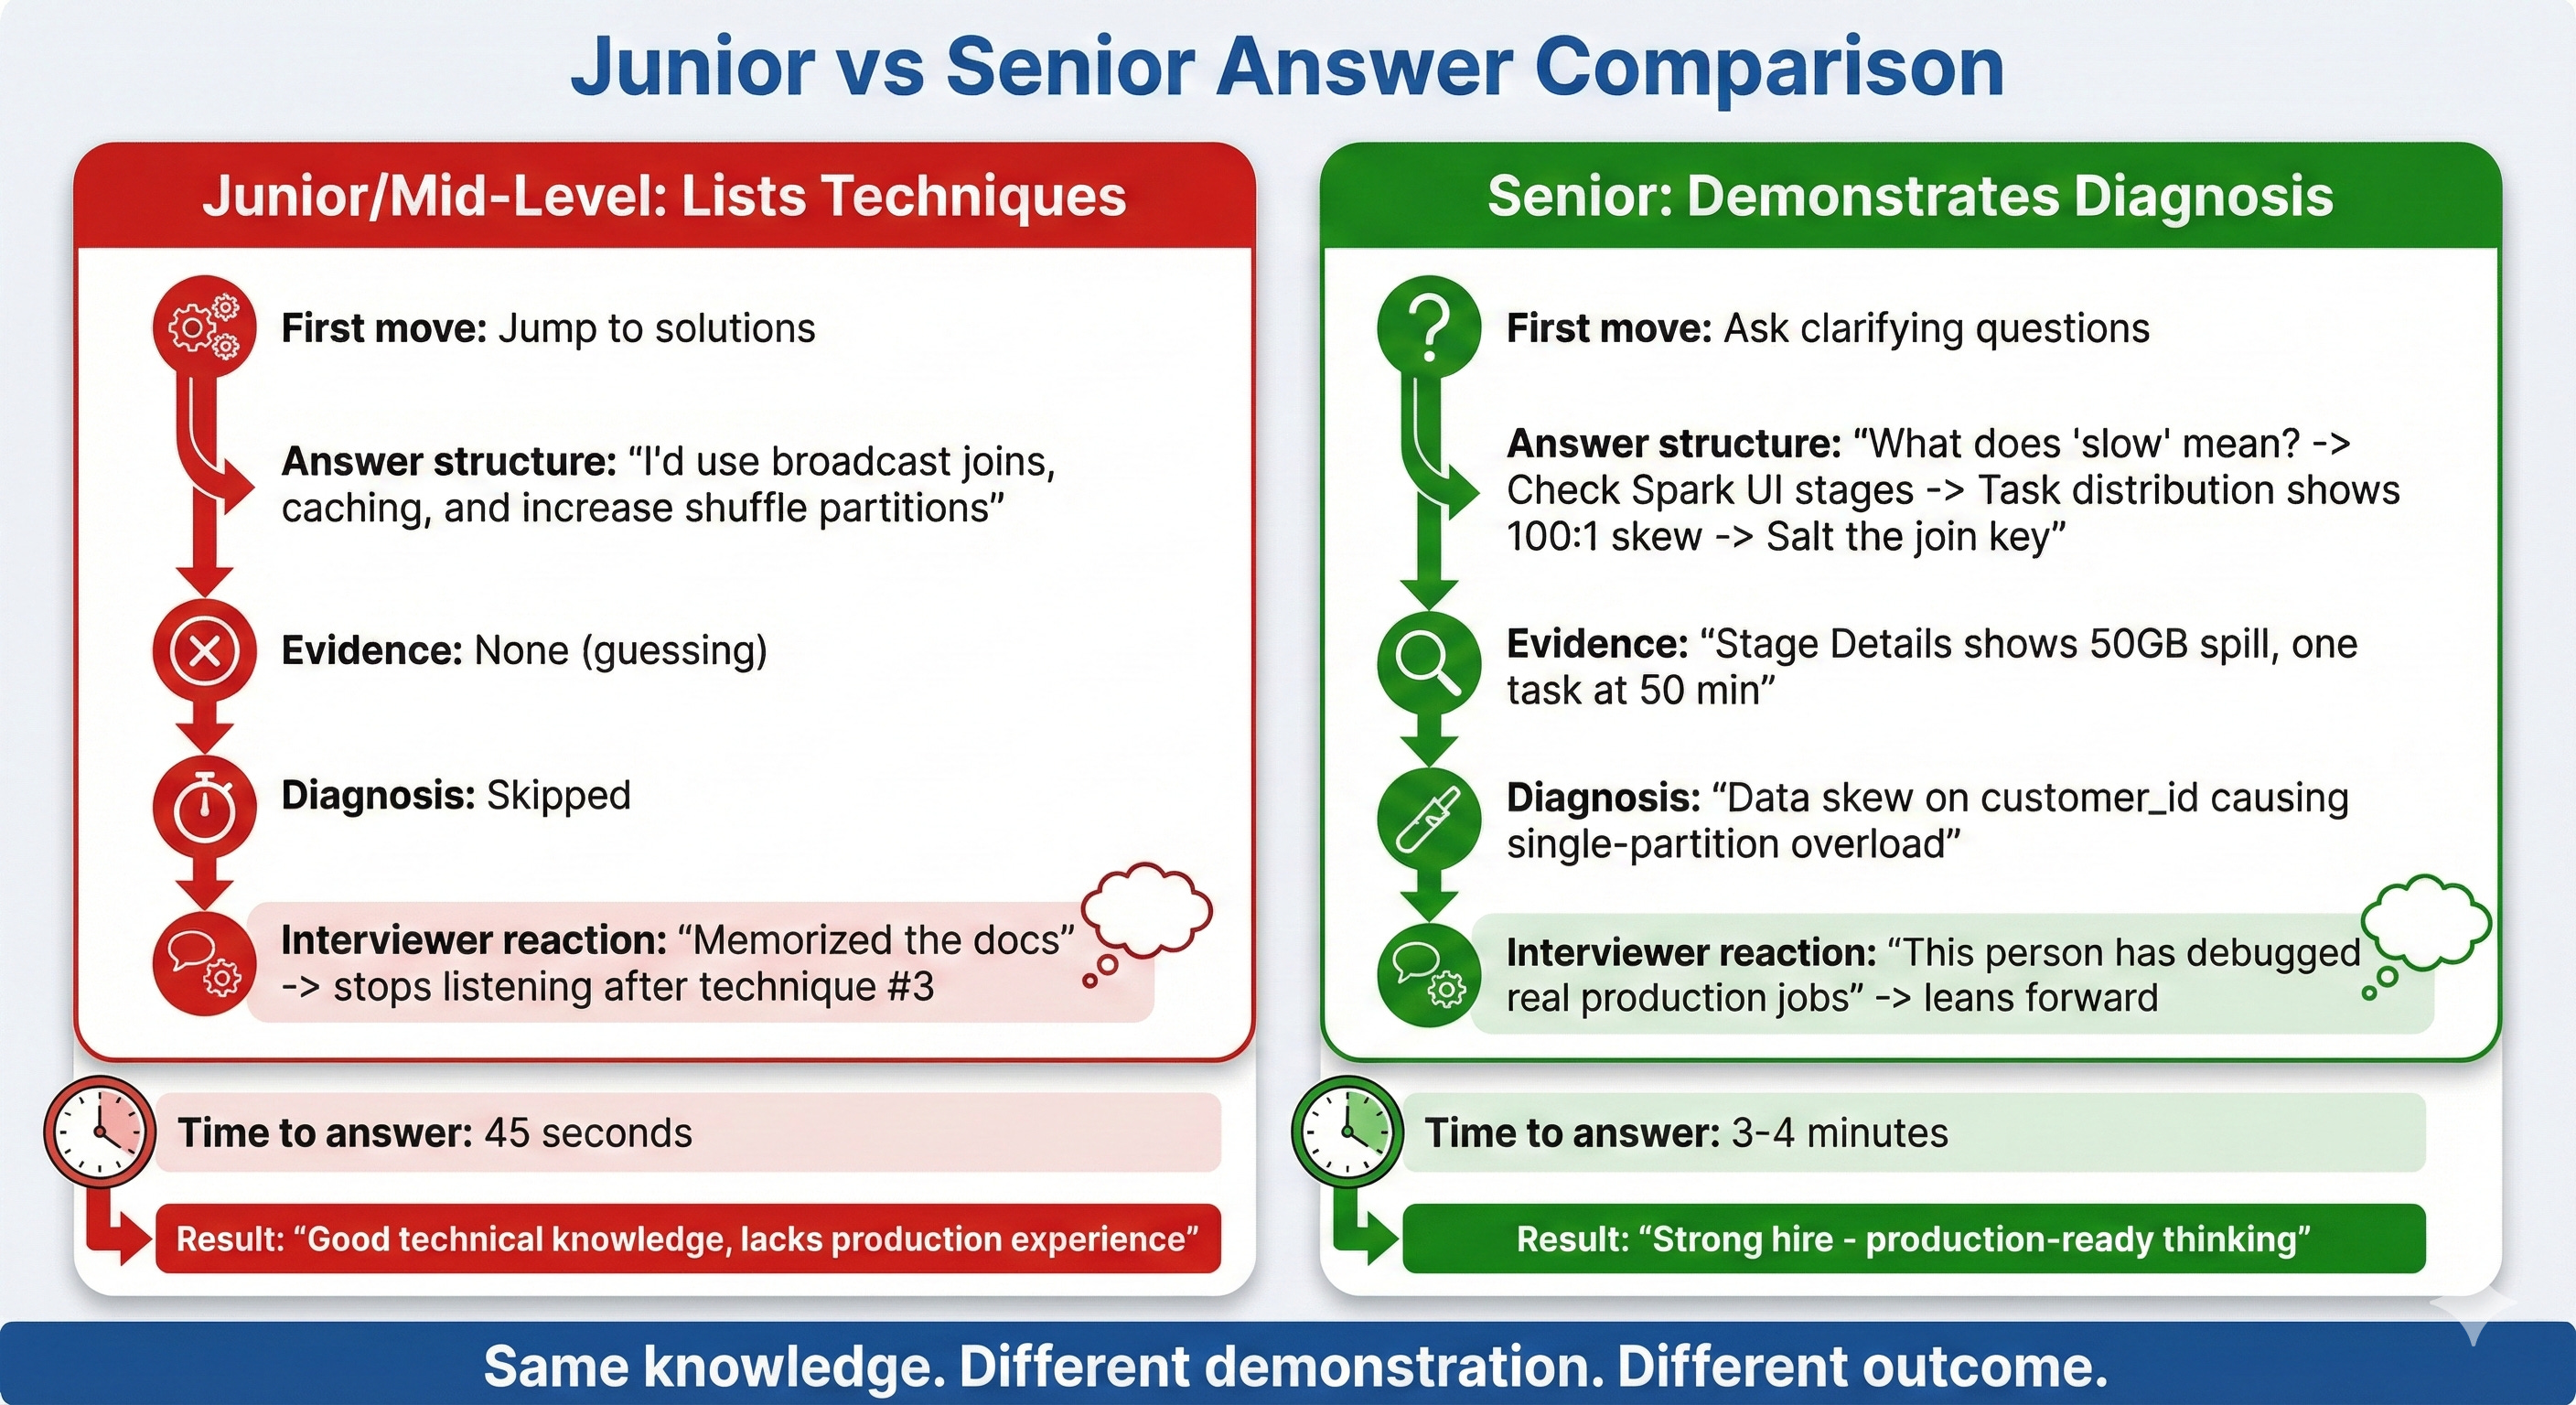
Interviewer for $200k Databricks Data Engineering roles told me: “When candidates just list optimization techniques, I already know they’re mid-level.”
Most candidates walk into Spark performance questions armed with the same arsenal: broadcast joins, caching, partition tuning, shuffle optimization. They rattle off techniques like a grocery list and wonder why they get passed over for candidates who “knew less.”
The problem isn’t the techniques. It’s that listing techniques proves you read the docs. It doesn’t prove you can diagnose a 500GB production job under pressure.
Here’s what interviewers actually evaluate, how to demonstrate it, and the practice framework to build diagnostic instinct before your next interview.
The Optimization Trap: Why Your Preparation Backfires
Every Databricks interview includes some version of “How would you optimize this slow Spark job?” And every candidate prepares the same way: memorize a list of optimization techniques, practice explaining each one, hope the interviewer asks about the one you know best.
Here’s the problem with this approach.
What Candidates Prepare
The typical preparation checklist looks like this:
Broadcast joins for small tables
Caching frequently accessed DataFrames
Adjusting shuffle partition count
Repartitioning before writes
Using Delta Lake file compaction
Enabling AQE (already on by default)
Candidates memorize when to use each technique, practice explaining the mechanics, and walk into the interview feeling ready.
Why Interviewers Stop Listening
The interviewer has heard this list 200 times. By the third technique, they’ve already categorized you as “memorized the docs, hasn’t debugged production.”
Here’s what the interviewer told me directly: “I ask about Spark optimization to see how someone thinks, not what they know. Every candidate knows broadcast joins. I need to see if they can figure out WHY a job is slow before jumping to solutions.”
The distinction matters. Listing techniques is a knowledge test. Diagnosing bottlenecks is a skill demonstration.
Knowledge tests tell the interviewer you can pass a certification exam. Skill demonstrations tell them you won’t panic when a production job runs 10x slower than expected on a Tuesday morning.
The Preparation Gap
Most candidates spend 80% of their prep time on techniques and 20% on diagnosis. The ratio should be reversed.
Techniques are table stakes. Every candidate at the $200k level knows them. What separates “good” from “offer-winning” is the ability to look at a slow job and systematically narrow down the root cause before proposing any fix.
How Interviewers Actually Evaluate Spark Performance Answers
Let’s look at the hidden scorecard. When an interviewer asks “How would you optimize this slow Spark job?”, they’re tracking three distinct signals.
Signal #1: Diagnostic Instinct
What they’re listening for: Does the candidate ask questions before proposing solutions?
Junior response: “I’d add caching for the DataFrames, increase shuffle partitions, and check if we can use broadcast joins.”
Senior response: “Before I suggest anything, I’d want to understand a few things. What does ‘slow’ mean here? Is it taking 10 minutes instead of 5, or 3 hours instead of 20 minutes? Those are fundamentally different problems.”
Why this matters to interviewers: In production, jumping to solutions without diagnosis wastes time and often makes things worse. Adding caching to a job that’s slow because of data skew doesn’t help. Increasing shuffle partitions when the bottleneck is disk spill doesn’t help. The interviewer needs to know you won’t burn 4 hours trying random fixes.
What the senior response signals:
You’ve debugged enough production jobs to know that “slow” has many causes
You understand that different root causes require different fixes
You won’t waste company time and compute on trial-and-error optimization
The follow-up questions that impress:
After establishing what “slow” means, seniors ask:
“When did it start being slow? Was it always slow or did performance degrade recently?” (This distinguishes data growth issues from code regression.)
“How much data is this job processing? 10GB vs 500GB changes the entire approach.” (This shows you understand that optimization strategies depend on data volume.)
“Is this a batch job or streaming? What’s the SLA?” (This demonstrates you think about business context, not just technical optimization.)
Each question narrows the diagnostic space. By the time you propose a solution, it’s targeted and justified.
Signal #2: Bottleneck Precision
What they’re listening for: Can the candidate distinguish between different types of performance problems?
Junior response: “I’d increase shuffle partitions from 200 to 1000.”
Senior response: “If one task is processing 200GB while others process 2GB, that’s data skew, not a partition count problem. Increasing partitions won’t help because the skewed key still lands on one partition.”
Why this matters: There are roughly 5 categories of Spark performance problems, and they require different fixes. Applying the wrong fix wastes time and can make things worse.
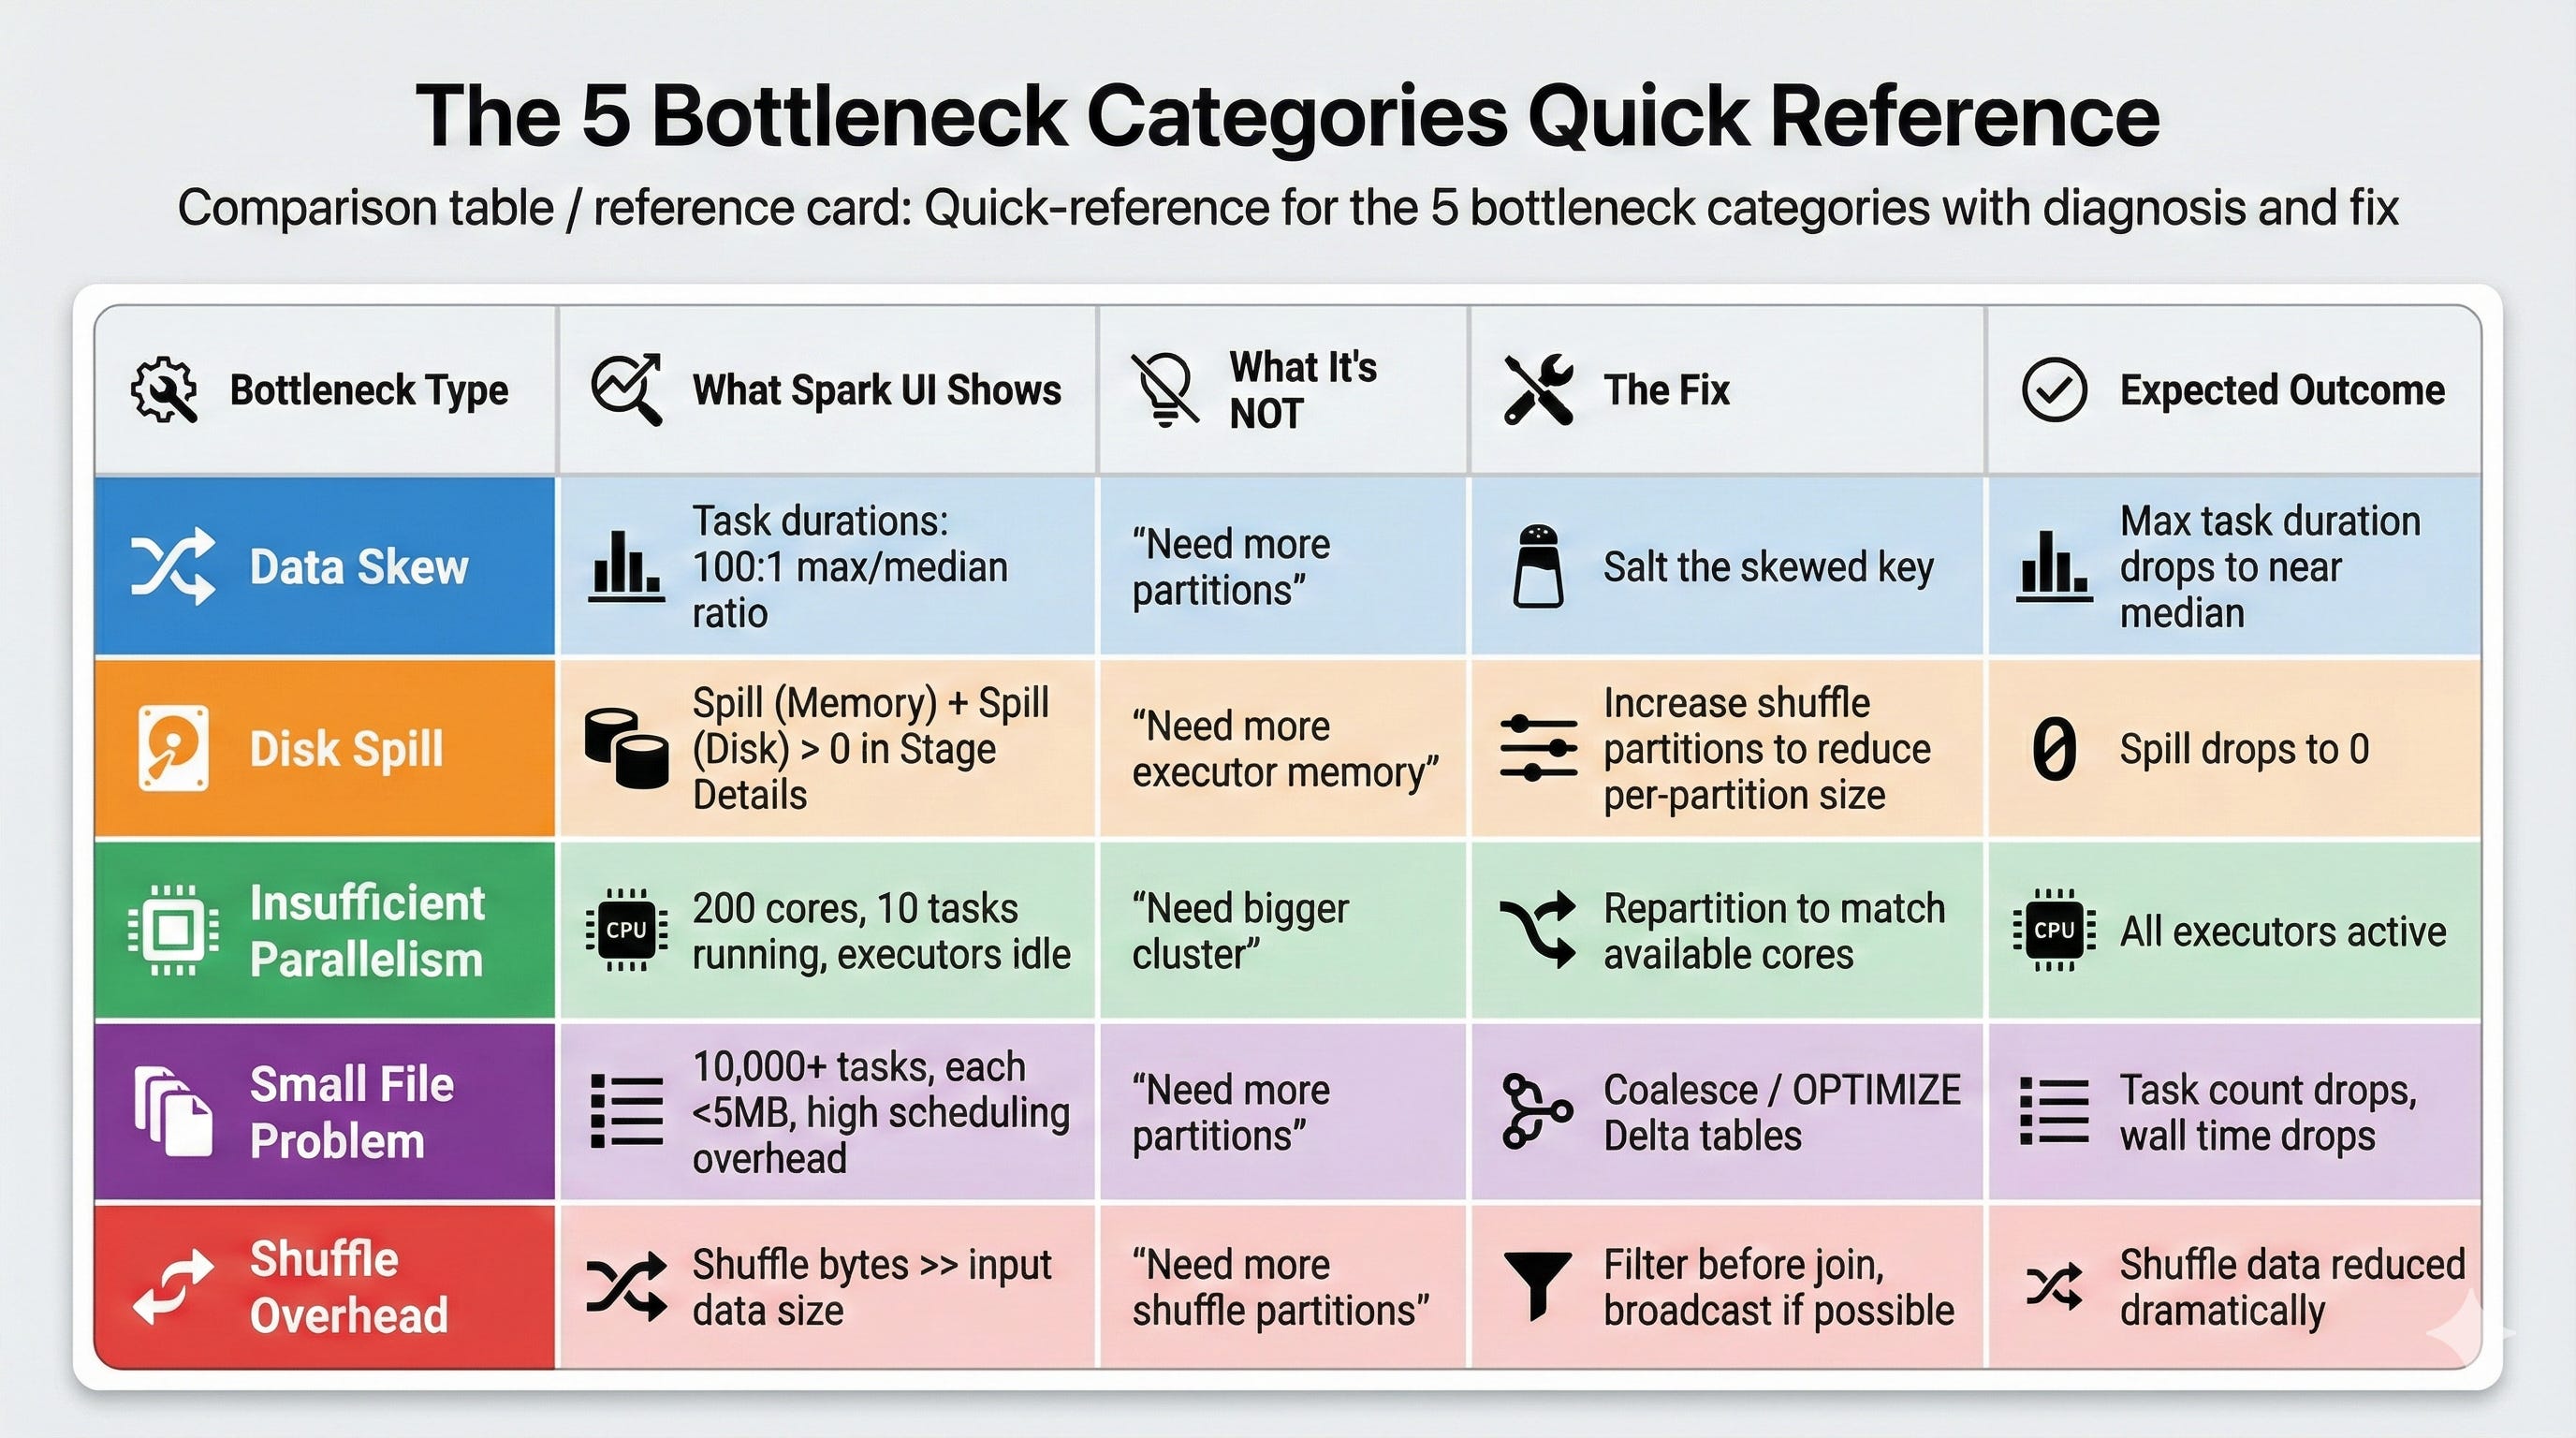
The 5 bottleneck categories interviewers expect you to distinguish:
1. Data Skew
What it looks like: One or two tasks take 100x longer than others in the same stage. The Spark UI shows wildly uneven task durations.
What it’s NOT: A partition count problem. If data is skewed on a key, adding more partitions doesn’t redistribute the hot key.
How to diagnose: Check the Spark UI’s Stage Details page. Look at the task duration distribution. If the median is 5 seconds but the max is 10 minutes, you have skew.
What to propose: Salt the skewed key (add a random suffix to spread it across partitions), use a two-phase aggregation (pre-aggregate with salt, then aggregate without), or filter and handle the skewed key separately.
2. Shuffle Overhead
What it looks like: Shuffle read/write metrics are disproportionately large. Jobs spend most time in shuffle stages, not computation.
What it’s NOT: Always a “too many partitions” problem. Sometimes it’s too few partitions causing large partition sizes.
How to diagnose: Check the Spark UI for shuffle read and shuffle write bytes. If shuffle data exceeds the actual computation data, your shuffle is the bottleneck. Also check if the number of shuffle partitions results in partition sizes over 200MB each.
What to propose: Reduce unnecessary shuffles by reordering operations (filter before join), check if broadcast join eliminates the shuffle entirely, or adjust shuffle partitions based on the actual data size.
3. Disk Spill
What it looks like: The Spark UI’s Stage Details page shows “Spill (Memory)” and “Spill (Disk)” metrics. Tasks are running but spending most time writing to and reading from disk.
What it’s NOT: Always a “need more memory” problem. Often it’s a partition size problem where individual partitions exceed executor memory.
How to diagnose: Stage Details page shows spill metrics. If spill to disk is 50GB+ for a stage, partitions are too large for executor memory.
What to propose: Increase shuffle partitions to reduce per-partition size, or repartition the data before the expensive operation. Sometimes increasing executor memory helps, but it’s more expensive than fixing the partition size.
4. Insufficient Parallelism
What it looks like: The cluster has 100 cores but only 10 tasks are running. Most executors are idle during the stage.
What it’s NOT: A cluster sizing problem. The cluster has capacity; the job isn’t using it.
How to diagnose: Check the Spark UI’s Executors tab. If most executors show low utilization during a stage, the data isn’t parallelized enough.
What to propose: Repartition the data to match available parallelism before the expensive operation. Check if the input source has few files (common with small Delta tables that haven’t been compacted).
5. Small File Problem
What it looks like: A stage has 10,000 tasks but each processes only 1-2MB. Task scheduling overhead dominates actual computation time.
What it’s NOT: A “need more partitions” problem. It’s the opposite.
How to diagnose: Check the number of tasks vs. data size. If you have 10,000 tasks processing 20GB total, each task is handling 2MB. The overhead of launching and managing 10,000 tasks exceeds the processing time.
What to propose: Coalesce before the operation to reduce task count, or compact the input files. For Delta tables, run OPTIMIZE to compact small files.
Signal #3: Evidence-Based Fixes
What they’re listening for: Does every proposed fix connect to specific evidence?
Junior response: “I’d optimize the join strategy.”
Senior response: “The Stage Details page shows 50GB spill to disk on the join stage. The task duration distribution shows one task at 50 minutes while others finish in 30 seconds. That tells me we have a skewed join key causing one partition to exceed executor memory. I’d salt the skew key to distribute it, which should eliminate the spill and bring that task duration down.”
Why this matters: In production, you can’t try random optimizations and hope one works. Every optimization attempt costs compute time and engineering hours. Interviewers need to know your fixes are targeted, not spray-and-pray.
The evidence chain interviewers want to see:
Observation: “The Spark UI shows X” (specific metric or behavior)
Diagnosis: “This tells me the bottleneck is Y” (interpretation of evidence)
Fix: “So I’d do Z” (targeted solution that addresses the diagnosed bottleneck)
Expected outcome: “This should result in W” (what changes after the fix)
Each link in the chain must connect. If you skip from observation to fix without diagnosis, the interviewer marks you as “guessing.” If you propose a fix without specifying expected outcome, you can’t verify it worked.
The Complete Diagnostic Framework: How to Answer Like a Senior
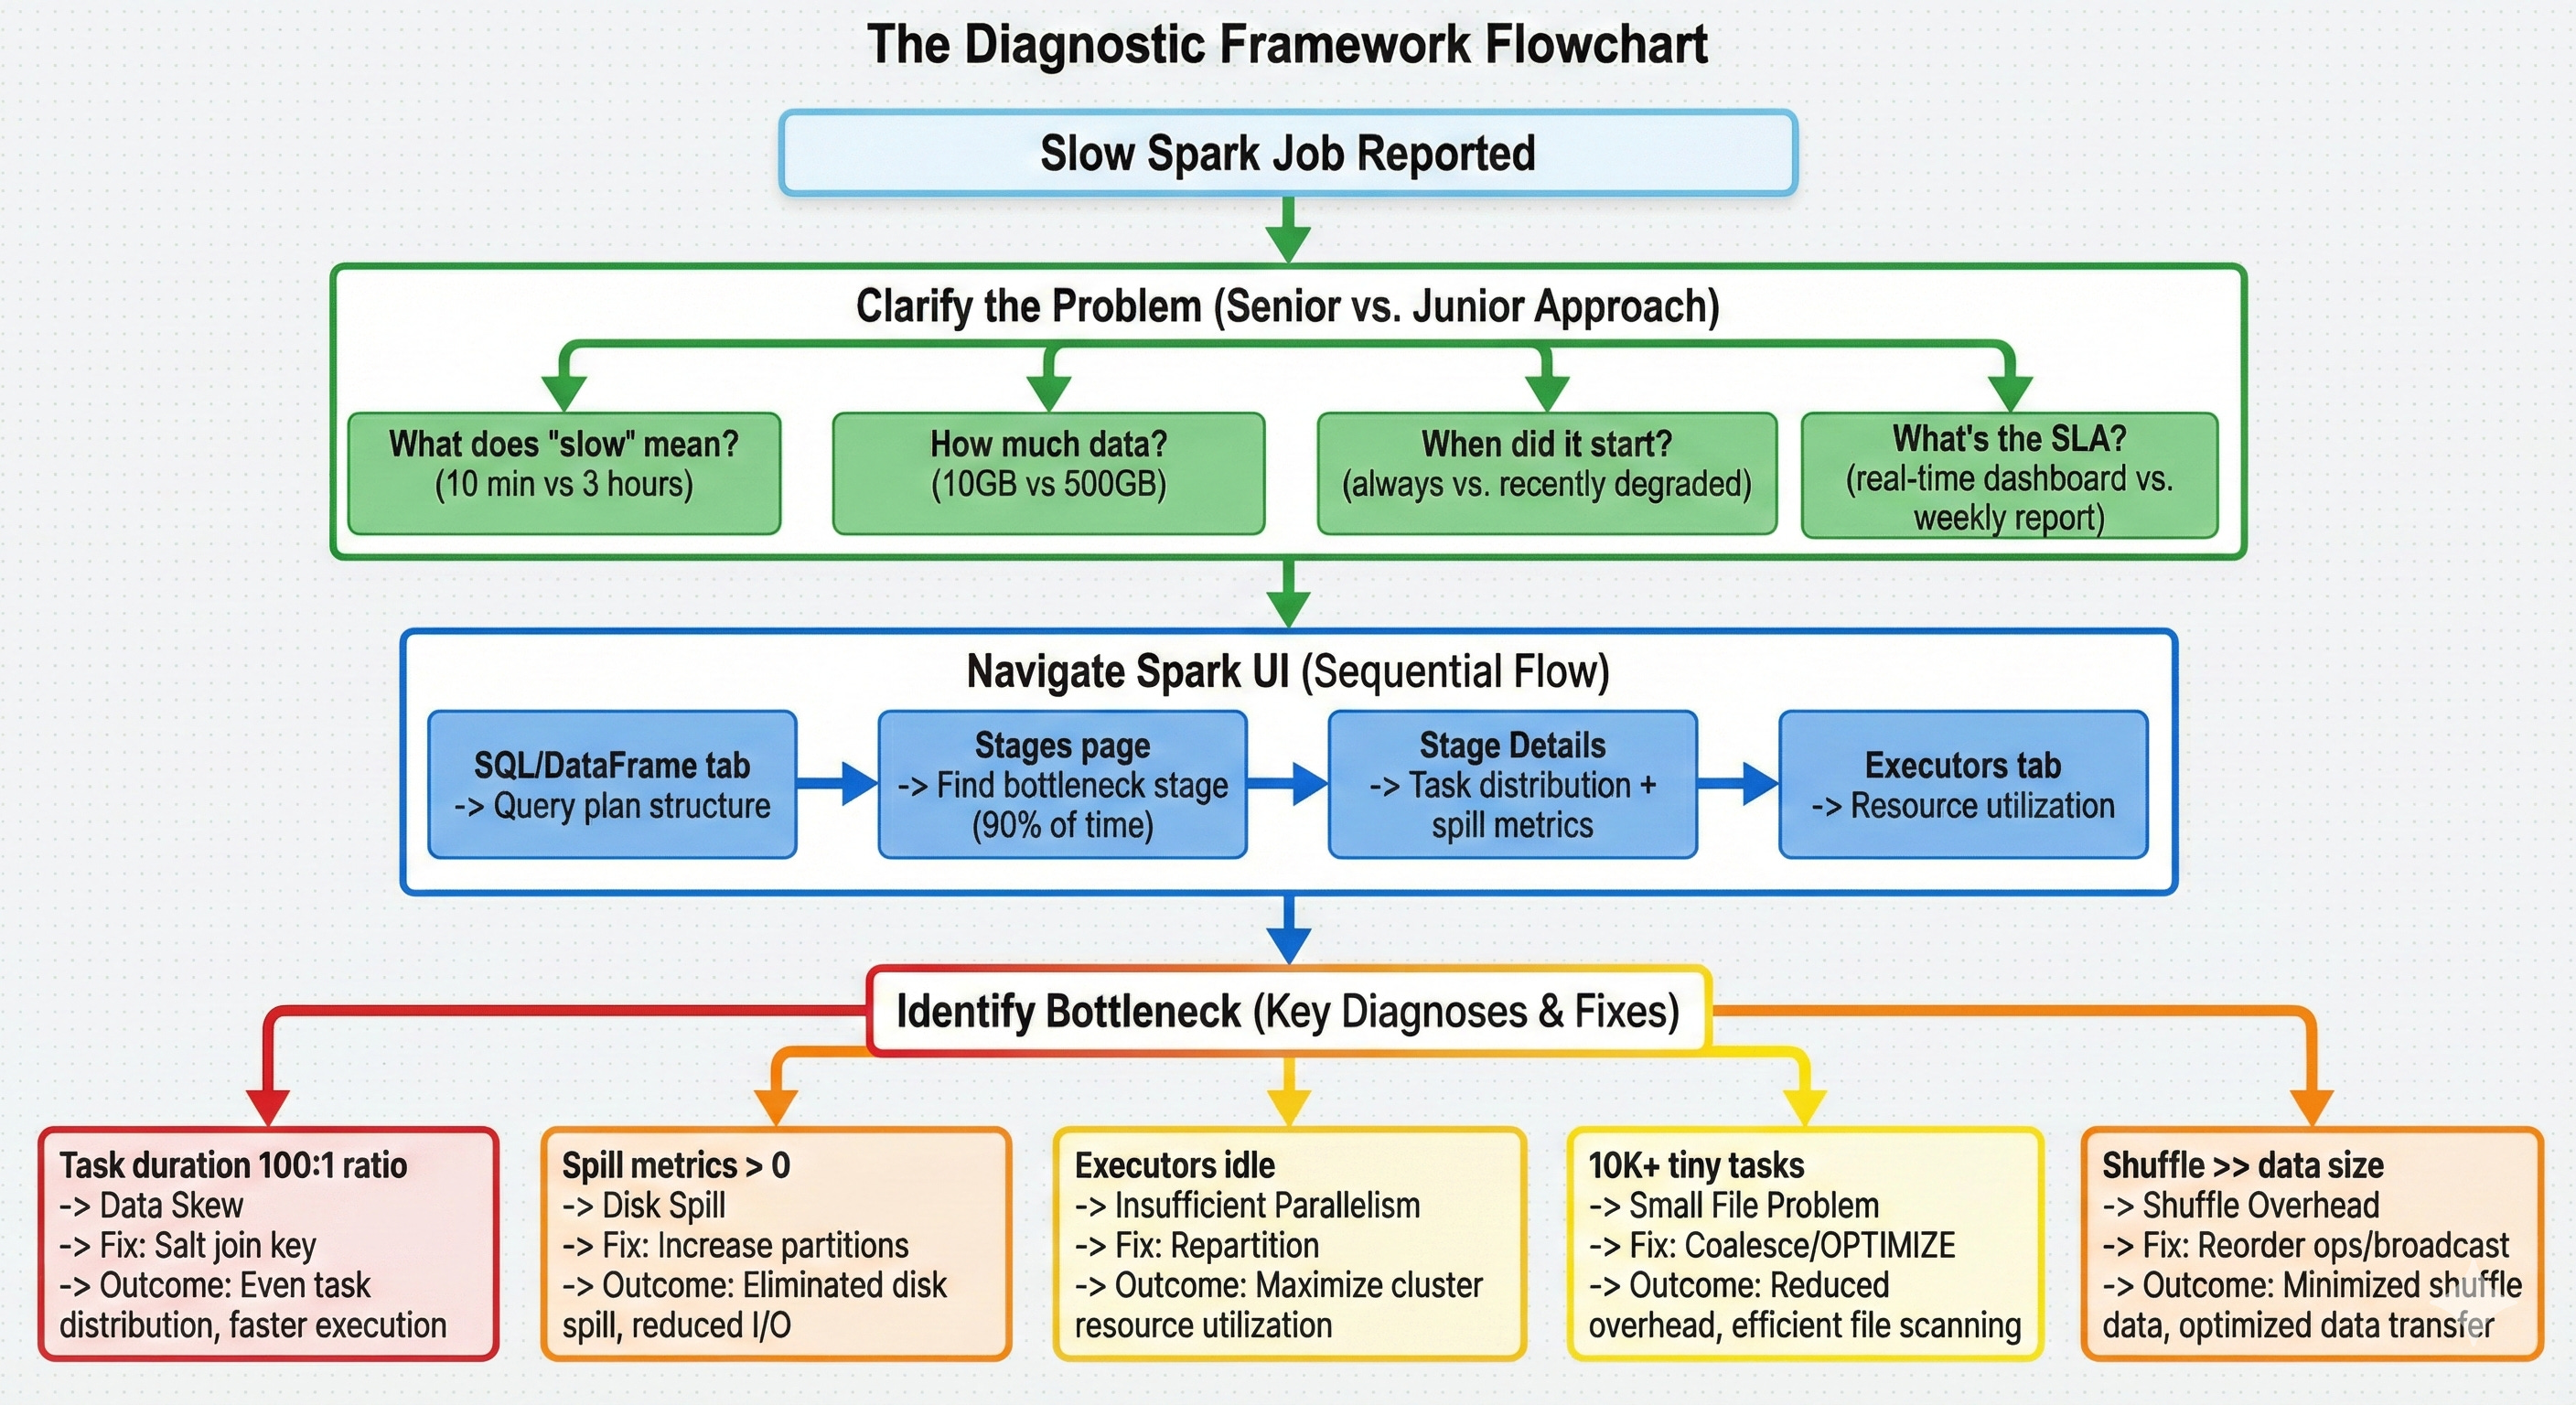
Here’s the step-by-step approach that gets offers. Practice this sequence until it’s automatic.
Step 1: Clarify the Problem (Before Anything Else)
Ask these questions in order:
“What does ‘slow’ mean here?” 10 minutes vs. 3 hours are completely different problems. A 10-minute job that should take 5 might just need a minor tune-up. A 3-hour job that should take 20 minutes has a fundamental bottleneck.
“How much data is involved?” 10GB vs. 500GB changes the entire diagnostic approach. Small data problems are usually code issues. Large data problems are usually distribution issues.
“When did it start being slow?” If it was always slow, it’s likely a design issue. If it recently degraded, check for data growth or upstream changes.
“What’s the SLA and business impact?” This shows you think about prioritization. A job that feeds a real-time dashboard needs immediate attention. A weekly analytics job can wait for a thoughtful fix.
This alone separates you from 85% of candidates. Most jump straight to techniques. You’re demonstrating that you understand diagnosis comes before treatment.
Step 2: Navigate the Spark UI Systematically
Once you understand the problem scope, walk through your diagnostic approach:
“First, I’d check the SQL/DataFrame tab for the query plan.” This reveals the logical structure: what joins, aggregations, and shuffles are involved. Look for operations that shouldn’t be there (unexpected shuffles, missing predicate pushdown).
“Then I’d look at the Stages page for time distribution.” This shows where time is actually spent. If one stage takes 90% of the total time, that’s where the bottleneck is. Don’t optimize a 5-second stage when a 45-minute stage exists.
“Within the slow stage, I’d check the Stage Details for task distribution.” This is where you find skew (one task dramatically slower than others), spill (memory/disk spill metrics), and parallelism issues (fewer tasks than available cores).
“Finally, I’d check the Executors tab for resource utilization.” This reveals whether the cluster is actually being used. Low CPU utilization with high task times points to I/O bottlenecks or data locality issues.
The key: you’re narrating a systematic process, not listing random things to check. Each step narrows the diagnosis.
Step 3: Name the Bottleneck with Precision
Based on what the Spark UI shows, name the specific bottleneck:
“The task duration distribution shows a 100:1 ratio between max and median. That’s data skew.“
“Stage Details shows 80GB of spill to disk. That’s memory pressure from oversized partitions.“
“The cluster has 200 cores but only 8 tasks are running. That’s insufficient parallelism.“
“There are 50,000 tasks each processing 500KB. That’s small file overhead.“
“The shuffle stage reads 300GB for a 50GB dataset. That’s an exploding join or unnecessary shuffle.“
Be precise. “It might be a performance issue” is useless. “Task distribution shows 100:1 skew on the join stage” is specific and demonstrates you’ve actually used the Spark UI under pressure.
Step 4: Propose a Targeted Fix with Expected Outcome
Connect every fix to the diagnosis:
For data skew: “I’d salt the join key with a random suffix, which distributes the hot key across multiple partitions. This should bring the max task duration from 50 minutes down to roughly the median of 30 seconds.”
For disk spill: “I’d increase shuffle partitions from 200 to 2000, which reduces per-partition size from 250MB to 25MB. This should eliminate the spill since each partition fits in executor memory.”
For insufficient parallelism: “I’d repartition the input to match available cores. With 200 cores, I want at least 200 partitions of roughly equal size.”
For small files: “I’d coalesce to reduce task count from 50,000 to 500, each processing about 50MB. The scheduling overhead drops dramatically.”
For shuffle overhead: “I’d reorder operations to filter before the join, reducing the data that needs to shuffle. If the filtered table is small enough, a broadcast join eliminates the shuffle entirely.”
Notice the pattern: diagnosis leads directly to a specific fix with a specific expected outcome. No guessing. No “I’d try a few things and see.”
Common Follow-Up Questions and What They Actually Evaluate
After your initial answer, interviewers probe deeper. Here’s what they’re looking for with each follow-up.
