
The Spark Cluster Parallelism Guide: Why 32 Nodes Can Be Slower Than 4
The task-to-core ratio that separates $600/month waste from systematic diagnosis - with the complete decision framework for repartition vs. scale

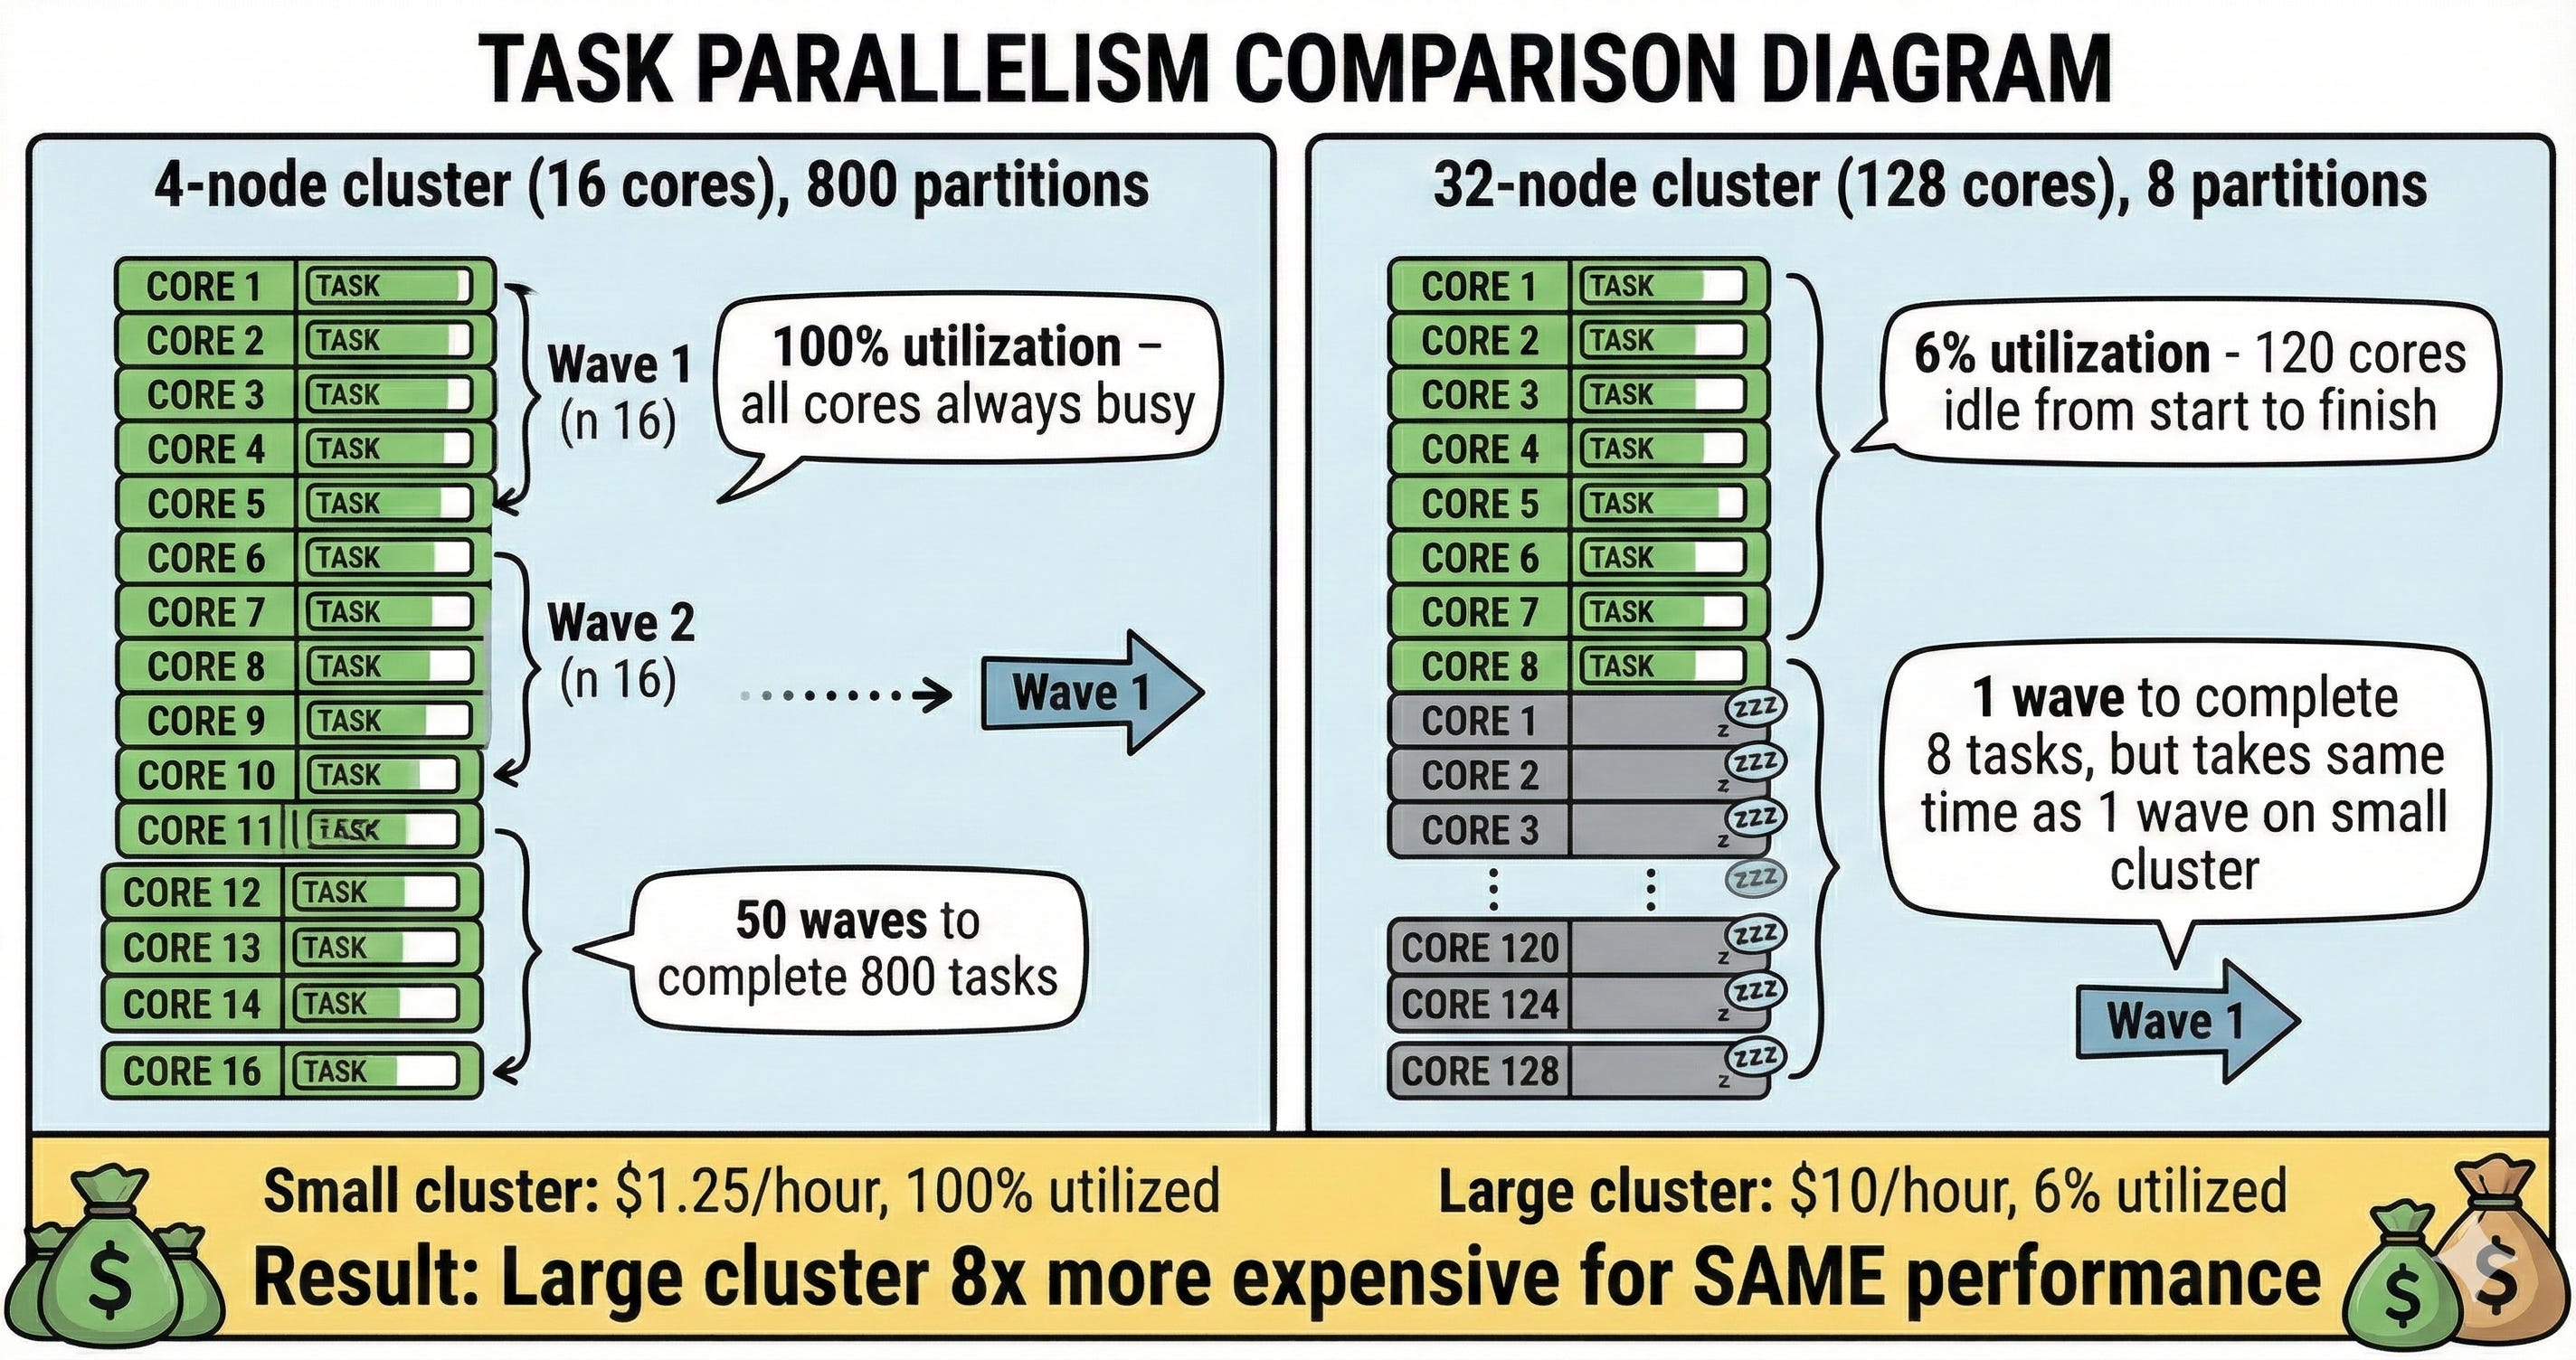
Everyone knows bigger Spark clusters are faster. What’s less obvious: a 4-node cluster with 800 partitions beats a 32-node with 8.
Task-level parallelism is the hidden bottleneck that makes “scale up” fail.
This isn’t academic theory - it’s the #1 reason teams waste thousands on underutilized clusters while their jobs stay slow. Understanding this mechanism separates engineers who throw hardware at problems from those who diagnose systematically and fix root causes.
Here’s what’s actually happening under the hood, and how to leverage this knowledge when your next performance crisis hits.
Revelation #1: One partition = One task
Each partition creates exactly ONE task. With 8 partitions, Spark schedules 8 tasks - even with 128 cores waiting.
Your 32-node cluster (128 cores) runs 8 tasks. 120 cores sit idle. You’re paying for 128 cores but using 6%.
What this actually means for you:
When you look at the Spark UI under the Stages tab, you see “Tasks: 8/8” with a duration of 45 minutes. Meanwhile, your cluster has been running with 128 cores for those same 45 minutes. The math is brutal: 8 tasks × 45 minutes = 360 core-minutes of actual work. 128 cores × 45 minutes = 5,760 core-minutes billed. You paid for 5,760 core-minutes to accomplish 360 core-minutes of work. That’s 93.75% waste.
This happens most commonly after narrow transformations on small datasets or after reading from sources that don’t naturally partition well - single CSV files, small Delta tables written with low parallelism, or API responses consolidated into a few partitions.
How to diagnose this in your next slow job:
Open Spark UI → Click the slow stage → Look at the “Tasks” section header. You’ll see something like “Tasks: 8/8 (8 killed)” or “Tasks: 12/12”. Compare that number to your total cores. If you have 128 cores and see 8 tasks, you’ve found your problem. The stage timeline will show all tasks running simultaneously (good) but the cluster metrics will show most executors idle (bad).
The key diagnostic pattern: Look for stages where task count is dramatically lower than core count AND the stage takes significant wall-clock time. A 30-second stage with 8 tasks on 128 cores is annoying but not catastrophic. A 45-minute stage with 8 tasks on 128 cores just cost you real money.
Revelation #2: The parallelism bottleneck
4-node cluster (16 cores) with 800 partitions: All 16 cores busy processing tasks in waves until done.
32-node cluster (128 cores) with 8 partitions: Only 8 cores active, 120 idle from start to finish.
Small cluster: 100% utilization. Large cluster: 6% utilization, 94% waste.
Why this pattern appears in production:
The most common scenario is reading a single large file or a dataset someone else created with poor partitioning, then running transformations. You’re inheriting their parallelism choices. A 50GB CSV file (yes, people still use these) gets read as one partition by default in many frameworks. Spark then carries that single partition through all downstream transformations unless you explicitly repartition.
Another culprit: Delta tables written by streaming jobs with low parallelism settings. Someone configured maxFilesPerTrigger=1 for careful incremental processing, which created hundreds of small batches each with 1-2 partitions. Now when you read the entire table for a batch job, you get 200 partitions - which sounds reasonable until you realize your cluster has 512 cores.
How to use this knowledge when jobs slow down:
First, check the problematic stage’s input. Go to Spark UI → Storage tab to see RDD/DataFrame partitions, or look at the stage’s input metrics. If you see “Input Size: 50GB, Partitions: 8”, that’s your smoking gun.
Second, trace backward through the DAG. Click on the stage’s parent stages. Often the low partition count originates from a specific operation - a file read, a coalesce someone added months ago to “optimize” output files, or a join with a small lookup table that forced everything into low parallelism.
Third, decide where to intervene. Repartitioning early (right after the problematic read) is almost always better than repartitioning late (before an expensive aggregation). The reason: you want your expensive transformations to benefit from parallelism, and shuffle cost is usually trivial compared to the time saved on subsequent operations.
Revelation #3: The costly mistake
Slow job. You scale from 4 to 32 nodes.
Still slow. Partition count didn’t change. You went from “some cores idle” to “most cores idle.”
Senior’s first question: “How many partitions vs cores?”
When scaling actually does help:
Scaling works when you have adequate partitions but tasks are individually slow due to computation or memory pressure. The diagnostic: Spark UI shows task count matching or exceeding core count, AND individual task durations are high (minutes each, not seconds), AND you see spill metrics or GC pressure in the executor metrics.
For example: 512 partitions on 16 cores, each task takes 5 minutes due to complex aggregations and sorts. Scaling to 128 cores means 512 tasks complete in 4 waves instead of 32 waves. Same work, but wall-clock time drops from 2.5 hours to 20 minutes because you’re parallelizing computation-bound work.
The decision tree: Tasks < Cores = repartition. Tasks >= Cores AND slow individual tasks = investigate task slowness. If task slowness is due to computation (not skew), then scale.
What You’ll Get in the Full Deep-Dive
After reading this, you’ll be able to diagnose slow Spark jobs in 5-10 minutes using the exact systematic approach seniors follow, and decide between repartition vs scale based on Spark UI metrics instead of guessing.
In the next 20 minutes, you’ll learn:
→ How to diagnose this in production: The exact Spark UI checks (Stages → Tasks → task count vs core count) and the 6-step diagnostic framework that catches parallelism, skew, memory, and I/O problems
→ When AQE helps and when it doesn’t: How to verify AQE actually optimized your job, when to manually repartition despite AQE, and what to check when AQE isn’t triggering
→ The practical formulas: Different partition counts for wide transformations (2x cores) vs narrow transformations (3-4x cores) vs final writes (match file size), and how to avoid the repartition trap
→ The complete diagnostic checklist: Step-by-step framework seniors use to identify slow stages, check parallelism, diagnose skew, detect memory pressure, and only then consider scaling - with real cost breakdowns ($75 → $600 wrong vs $18.75 correct)
→ When partitions aren’t the problem: How to recognize and fix slow individual tasks (perfect parallelism but 8-minute tasks), I/O bottlenecks, and driver issues
The difference between guessing and systematic diagnosis: days of iteration vs 10 minutes to fix.
The rest of this post is for premium subscribers. [Subscribe here] to get the complete walkthrough, decision frameworks, and production scenarios you’ll reference every time a job slows down.
