
Understanding Spark Shuffle: The Complete Architecture Guide
Why your 10-minute job became 2 hours, how data skew causes 100GB → 500GB inflation, and the three-phase mechanism behind every GROUP BY

𝗗𝗮𝘁𝗮 𝗘𝗻𝗴𝗶𝗻𝗲𝗲𝗿: “My Databricks job slowed from 10 minutes to 2 hours after adding a GROUP BY. The Spark UI says ‘shuffle read: 500GB.’ What’s actually happening?”
𝗦𝗽𝗮𝗿𝗸: “It’s not magic. It’s data movement.”
𝗗𝗮𝘁𝗮 𝗘𝗻𝗴𝗶𝗻𝗲𝗲𝗿: “Okay, what is shuffle?”
𝗦𝗽𝗮𝗿𝗸: “When you GROUP BY user_id, data for each user must land on the same executor. Shuffle is the network transfer that redistributes 500GB of data across 200 executors to make this happen. That’s your shuffle write phase.”
𝗗𝗮𝘁𝗮 𝗘𝗻𝗴𝗶𝗻𝗲𝗲𝗿: “Why is it slow?”
𝗦𝗽𝗮𝗿𝗸: “Each executor writes shuffle files to local disk, then 200 other executors read over the network. At 500GB, you’re bottlenecked by disk I/O and network bandwidth. Think of it as reorganizing 500GB into 200 sorted piles.”
𝗗𝗮𝘁𝗮 𝗘𝗻𝗴𝗶𝗻𝗲𝗲𝗿: “What if executors run out of memory during this?”
𝗦𝗽𝗮𝗿𝗸: “Spark spills to disk. When shuffle data exceeds executor memory, it writes temporary files to local ephemeral storage. In Databricks, this uses local_disk0 volumes. You’ll see ‘Spill (Memory)’ in Spark UI. That’s why your disk usage spikes.”
𝗗𝗮𝘁𝗮 𝗘𝗻𝗴𝗶𝗻𝗲𝗲𝗿: “Can I avoid shuffle?”
𝗦𝗽𝗮𝗿𝗸: “Not for GROUP BY. But you can reduce it - repartition by the same key before grouping, use broadcast joins for small tables, or enable AQE to optimize partition count. Shuffle is necessary, but controllable.”
𝗗𝗮𝘁𝗮 𝗘𝗻𝗴𝗶𝗻𝗲𝗲𝗿: “So shuffle is Spark moving data across executors to satisfy my operation, writing to disk when memory fills, and network I/O is the bottleneck?”
𝗦𝗽𝗮𝗿𝗸: “Exactly. That’s the whole mechanism - necessary, but optimizable.”
What Actually Happens During Shuffle
Now let’s look at what’s actually happening under the hood when you see that 500GB shuffle in Spark UI.
𝗗𝗮𝘁𝗮 𝗘𝗻𝗴𝗶𝗻𝗲𝗲𝗿: “You said shuffle has a write phase. What’s the full sequence?”
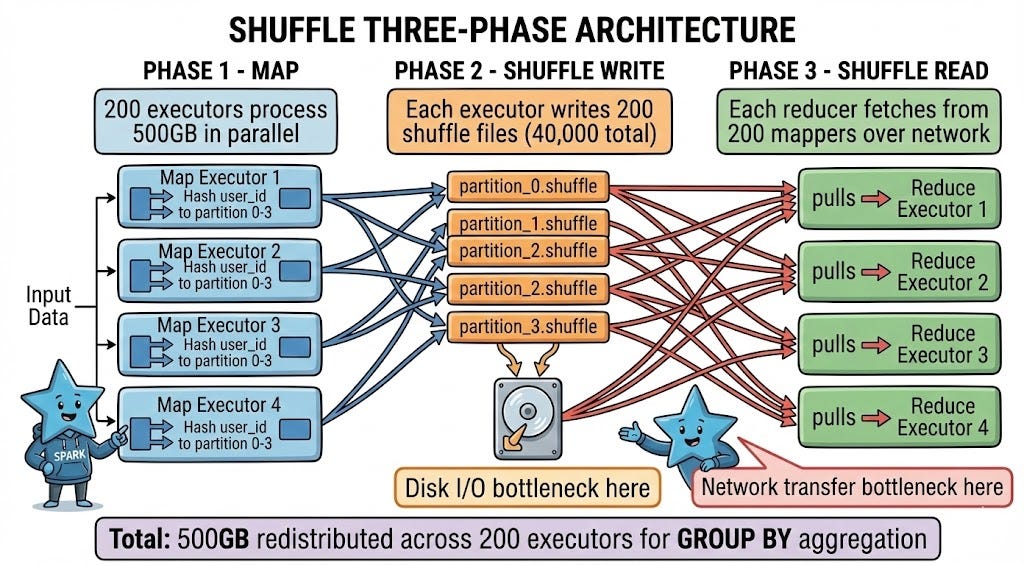
𝗦𝗽𝗮𝗿𝗸: “Three distinct phases: Map, Shuffle Write, and Shuffle Read.
In the Map phase, your 500GB dataset is processed by 200 executors in parallel. Each executor computes which partition each record belongs to based on your GROUP BY key. If you’re grouping by user_id and you have 200 reduce partitions, Spark hashes each user_id to determine which partition (0-199) should receive that record.
During Shuffle Write, each executor writes its output to 200 separate shuffle files on local disk - one file per destination partition. That’s 40,000 total shuffle files for 200 mappers writing to 200 reducers. Each file contains the records destined for a specific reduce partition.
Shuffle Read is when reduce executors pull data over the network. Each reducer connects to all 200 mappers and reads its designated partition file from each, combining data from 200 sources into one partition for aggregation.”
𝗗𝗮𝘁𝗮 𝗘𝗻𝗴𝗶𝗻𝗲𝗲𝗿: “That’s a lot of files. Is that where the I/O bottleneck comes from?”
𝗦𝗽𝗮𝗿𝗸: “Exactly. Writing 40,000 small files is slower than writing one large file due to filesystem overhead. Reading from 200 different executors over the network adds latency at every connection.
This is why you see disk I/O spike during shuffle write, then network transfer time during shuffle read. The Spark UI breaks these down separately - look for ‘Shuffle Write Time’ and ‘Shuffle Read Time’ in the Stage details.”
𝗗𝗮𝘁𝗮 𝗘𝗻𝗴𝗶𝗻𝗲𝗲𝗿: “How does Spark decide how many shuffle partitions to create?”
𝗦𝗽𝗮𝗿𝗸: “By default, it uses spark.sql.shuffle.partitions, which is 200 in most Databricks clusters. This means every shuffle operation creates 200 reduce partitions unless you override it.
For 500GB of shuffle data, 200 partitions means 2.5GB per partition. That’s reasonable - not too small (excessive overhead) and not too large (memory pressure). But if you had 50GB of data, 200 partitions would give you 250MB each, which creates unnecessary overhead for small tasks.
That’s where Adaptive Query Execution (AQE) helps. When enabled, AQE can coalesce small shuffle partitions automatically. If you have 200 partitions averaging 100MB each, AQE might combine them into 50 partitions of 400MB, reducing task overhead.”
𝗗𝗮𝘁𝗮 𝗘𝗻𝗴𝗶𝗻𝗲𝗲𝗿: “What about the spill to disk you mentioned? When exactly does that happen?”
𝗦𝗽𝗮𝗿𝗸: “During shuffle write and shuffle read, Spark uses executor memory to buffer data. The amount is controlled by spark.memory.fraction (default 60% of executor heap) and further divided between execution and storage.
When the shuffle buffer exceeds available execution memory, Spark spills to disk. This means sorting the in-memory data and writing it to local ephemeral storage. The exact location is controlled by spark.local.dir configuration - in Databricks, this uses local_disk0 volumes. These spill files are separate from shuffle files - they’re a fallback when memory fills.
In Spark UI, look for ‘Spill (Memory)’ and ‘Spill (Disk)’ metrics. If you see spill disk > 0, you’re memory-constrained. Common causes: data skew (one key has 50GB while others have 1GB), too many shuffle partitions with small executor memory, or simply processing more data than fits in memory.”
What You See in Production
Understanding the theory is one thing. Here’s what shuffle problems actually look like when they hit production.
𝗗𝗮𝘁𝗮 𝗘𝗻𝗴𝗶𝗻𝗲𝗲𝗿: “My job shows 100GB shuffle write but 500GB shuffle read. How is that possible?”
