
Why a Bigger Cluster Won't Fix Your Spark OOM
An OOM is one bucket overflowing, not total RAM

The most expensive mistake in a Databricks OOM is the one that feels the most responsible.
The job dies on “java heap space.” You open the cluster config, double the node size, rerun, and pray. Sometimes it works and you never learn why. Usually it dies again - same error, bigger bill - and now you’re convinced the data is just “too big.”
It almost never is.
An out-of-memory crash is not a verdict on total RAM. It’s a single bucket overflowing while the rest of the cluster sits half-empty. Sizing up scales every bucket at once, which is exactly why it feels like it should work and usually doesn’t - you’re pouring more water into a glass that isn’t the one cracking.
Here’s the mental model that separates an engineer who guesses from one who diagnoses. It’s the same model interviewers are probing when they ask “your Spark job OOMs - walk me through it.”
Already comfortable with the three-bucket model? Jump to “So I found the bucket. Now what?” for the per-bucket fix playbook.
Where an executor’s memory actually goes
Data Engineer: “I doubled the cluster memory. My job still hit OOM. If it’s not size, where is the memory even going?”
Spark: “Each executor splits its memory into three buckets, and they fail for completely different reasons.
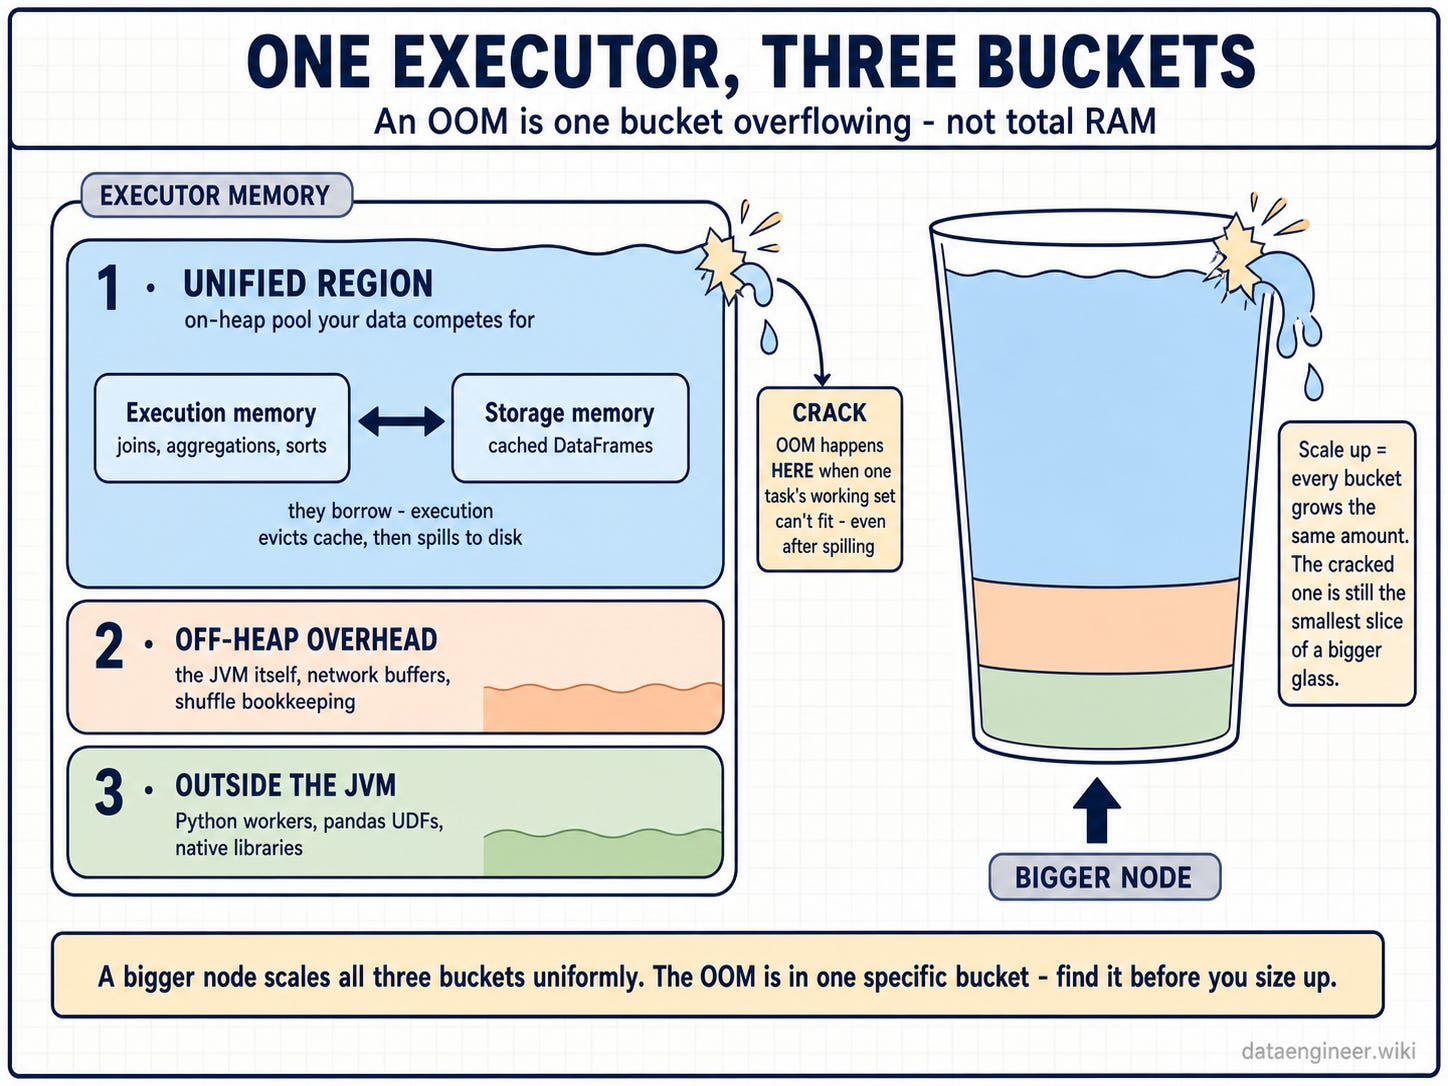
First, the unified region - the on-heap pool your data competes for. Second, off-heap overhead - the JVM itself, network buffers, shuffle bookkeeping. Third, anything running outside the JVM: Python workers, pandas UDFs, native libraries.
A bigger node scales all three proportionally. But an OOM is one bucket overflowing. Scale everything and the cracked bucket is still the smallest slice of a bigger glass.”
Data Engineer: “Start with the unified region. What’s actually fighting for space in there?”
Spark: “Two tenants sharing one pool: execution memory - joins, aggregations, sorts - and storage memory - your cached DataFrames.
They borrow from each other. When execution needs room, it evicts cache. When it still can’t fit, it spills to disk. An OOM in this bucket only happens when a single task’s working set can’t fit its slice of execution memory - even after spilling.
That’s almost always skew. Not total volume.”
Data Engineer: “So a 200GB shuffle won’t OOM on its own?”
Spark: “Correct. 200GB spread evenly across 200 partitions is 1GB per task - Spark spills the overflow to disk and grinds through it. Slow, but alive.
What kills you is one fat partition. A skewed join key with 50 million rows landing on one task while every other task gets 100 thousand. That one task’s working set blows past its slice, and there’s nothing to spill to that helps - it needs the whole set in memory at once.
A bigger node gives that task a slightly bigger slice. The 50-million-row partition still doesn’t fit. Same crash, more money.”
The two buckets that aren’t skew
Data Engineer: “When does adding memory actually fix something, then?”
Spark: “When the failure isn’t in execution at all - when it’s the driver or the overhead bucket.
The driver OOMs when you pull data back to it. collect() on a 5GB result drags every row to one JVM that was never sized for it. A broadcast join where the ‘small’ side isn’t small does the same thing - the driver builds the broadcast table before shipping it out. Neither of these is an executor problem, and no amount of executor memory touches them.
The third bucket - off-heap and Python - balloons outside the JVM heap entirely. A pandas UDF materializing a huge group, a native library holding buffers Spark can’t see. Here you’re not starved for heap; you’re starved for the overhead slice. Bump the wrong slider and you’ve fed a bucket that was never hungry.”
Data Engineer: “How do I tell which bucket failed before I touch anything?”
Spark: “The error text and the location split it for you, and they cost nothing to read.
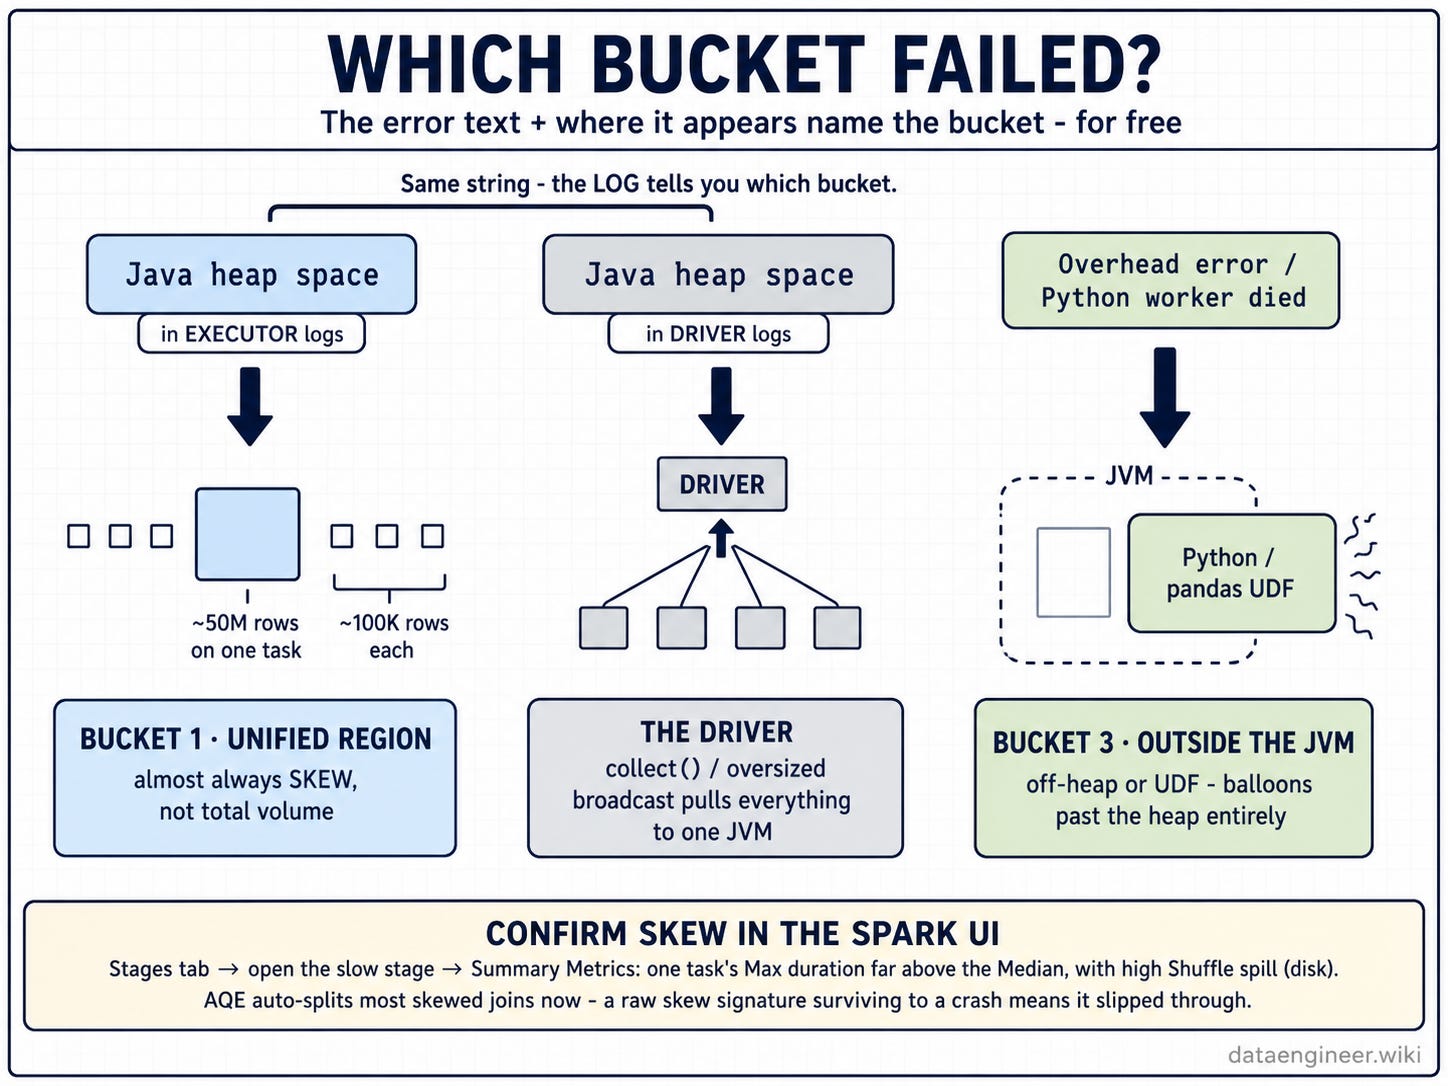
Java heap space in the executor logs - it’s the unified bucket. Go to the Spark UI, Stages tab, find the slow stage, open Summary Metrics. If one task’s Max duration sits far above the Median with high Shuffle spill (disk), that’s your skewed partition. AQE auto-splits most skewed joins now, so a raw skew signature surviving to a crash means it slipped through - a salt, a UDF boundary, something AQE couldn’t see.
Java heap space in the driver logs - that’s a collect or an oversized broadcast. Look for a collect, toPandas, or a broadcast hint on a table that grew.
Anything about overhead or a Python worker dying - that’s the third bucket. Off-heap or UDF.
Three error signatures, three buckets. The logs name the culprit before you open the cluster settings.”
“So I found the bucket. Now what?”
This is where most write-ups stop - and where the actual money is. Knowing the bucket is half the job. Here’s the fix for each, and critically, the fix you should not reach for.
Bucket 1 - the unified region (a skewed task in execution memory). Adding memory is the trap here.
Find the skewed key first - group by the join/aggregation key and look at the row-count distribution. One key dwarfing the rest confirms it.
If AQE skew join handling didn’t catch it, the join may not qualify - it splits skew on sort-merge and shuffle hash joins, but not on broadcast or non-join shuffles, and the skewed partition has to be large enough to trip AQE’s threshold.
Salt the skewed key: append a random bucket suffix to split the hot key across tasks, then aggregate in two passes. This is the durable fix when AQE can’t help.
For an aggregation, pre-aggregate before the wide shuffle so no single task ever holds the full hot group.
Last resort, not first: raise the shuffle partition count so each partition holds less - this only helps if skew is mild and the issue is partition size, not one monster key.
The driver (not one of the executor buckets). More executor memory does nothing. The fix is to stop moving data to the driver.
Replace
collect()with a write to a table, orlimit()before collecting if you genuinely need a peek.For “small” tables that broadcast-OOM, the table outgrew the broadcast threshold - let it shuffle-join instead by removing the broadcast hint, or genuinely shrink the side (filter, select columns) before the join.
Only raise driver memory when you have a legitimate reason to materialize a large result locally - which on a well-built pipeline is rare.
Buckets 2 & 3 - off-heap overhead and Python / outside the JVM. Bigger heap is the wrong slider.
Replace the Python/pandas UDF with a native Spark function or a Spark SQL expression wherever possible - that moves the work back inside the JVM where Spark manages the memory.
If the UDF is unavoidable, shrink what each invocation holds: avoid materializing a whole group at once, process in smaller batches.
Raising executor overhead memory is the band-aid, not the cure - it buys headroom for a UDF that’s structurally too greedy.
The pattern across all three: the bucket tells you which lever exists, and in two of the three cases the lever is “fix the code,” not “buy more cluster.”
Why this is a senior-interview question
“Your Spark job runs out of memory - walk me through it” is one of the most common senior Databricks screens, and it sorts candidates in one sentence.
“I’d increase executor memory” reaches for the cluster before the diagnosis - it’s the answer that caps you at the mid-level band. The answer that reads as senior is the bucket model out loud: read the error first, separate executor heap from driver heap from an overhead error, confirm skew in the Spark UI, and size the cluster last - only once you know which bucket overflowed.
Same instinct that keeps your cloud bill flat in production is the one that lands the offer in the room.
What’s the last OOM you fixed by finding the bucket - not just sizing up the cluster?
Premium Further Reading
These are the deep-dives a reader who just learned the three-bucket OOM model would naturally pick up next: the mechanics under each bucket and the interview answers they feed. Old posts are auto-archived for premium subscribers only.
This article splits an OOM into execution heap, driver heap, and off-heap, then says “fix the code, not the cluster.” The picks below go one level deeper on each bucket - skew and salting, the broadcast-driver crash, the shuffle underneath it all - and on the sizing call you make last.
Databricks Data Engineer Interview: A Broadcast Join Case Study: Why a 50MB table can cause a driver OOM crash, and how concurrency is the real culprit.
The Skew Question That Kills $200k Interviews: How seniors triage salting, AQE, and broadcast in 60 seconds
Understanding Spark Shuffle: The Complete Architecture Guide: Why your 10-minute job became 2 hours, how data skew causes 100GB → 500GB inflation, and the three-phase mechanism behind every GROUP BY
Right-Sizing Your Databricks Cluster: A 500 GB Case Study: A Practical Guide to Shuffle Partitions, Executor Sizing, and Handling Data Skew.
Spark Performance Interview Questions: What Interviewers Actually Evaluate: An interviewer’s insider view on the diagnostic framework that wins $200k+ Databricks Data Engineering offers.